Product workspace

Welcome to Graphclarity

Graph Clarity turns complex data into clear visual insights with dashboards, graph analytics, and reporting tools for teams to decide faster.

Brass vault keys, leather ledger cover, security token and coin tray on dark stone

Connected stack

Vertex Labs

01

Build clear dashboards, map links, and share reports that keep teams in sync.

02

Track live numbers in one shared view with filters and drill-downs.

03

Map nodes, links, and groups to spot paths, gaps, and key accounts.

04

Vertex Labs

Frosted sample vials, capped glass tubes, and slide carrier on brushed metal in cool lab light.

Vertex Labs

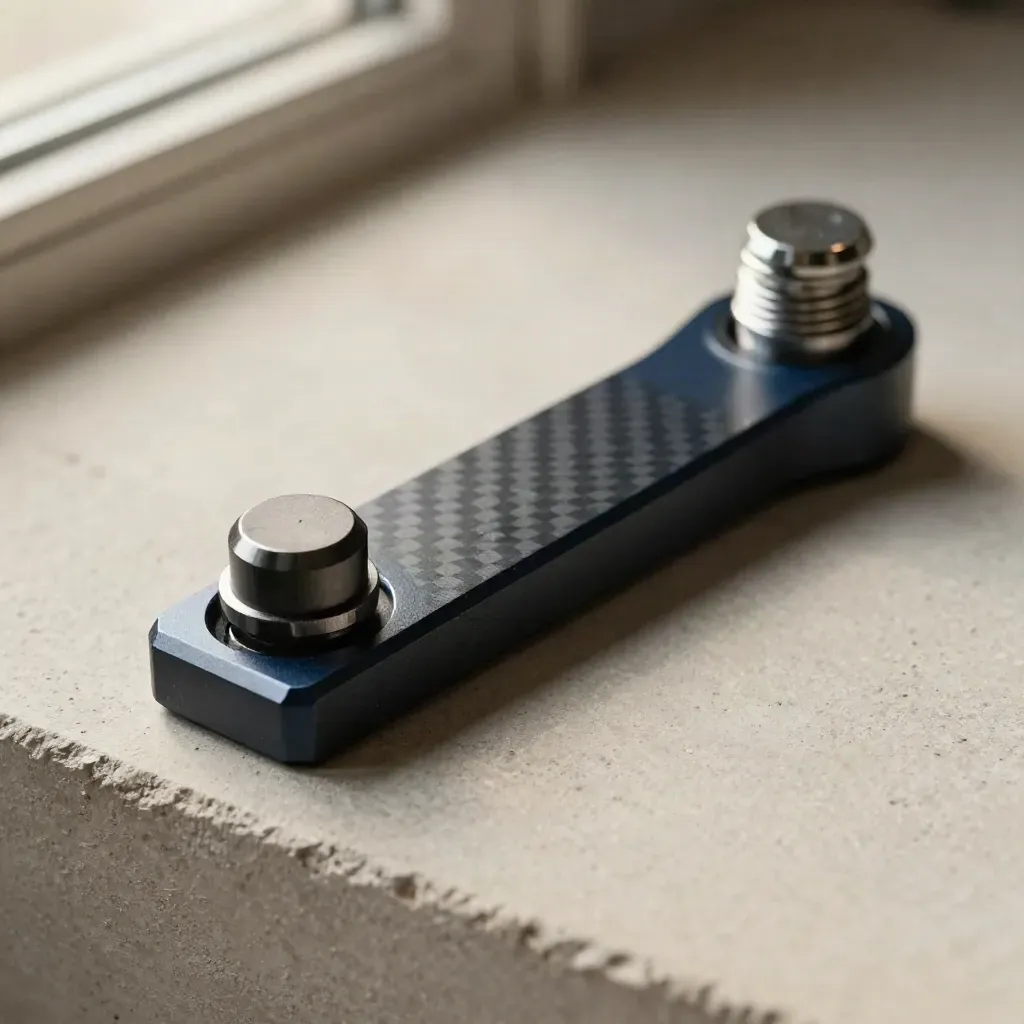
Aerospace bracket, rivet caps, and carbon-fiber spacer on pale stone with soft light.

Orion Data

Top-down macro of a steel tray with ampoules and coiled tubing on brushed metal.

BluePeak

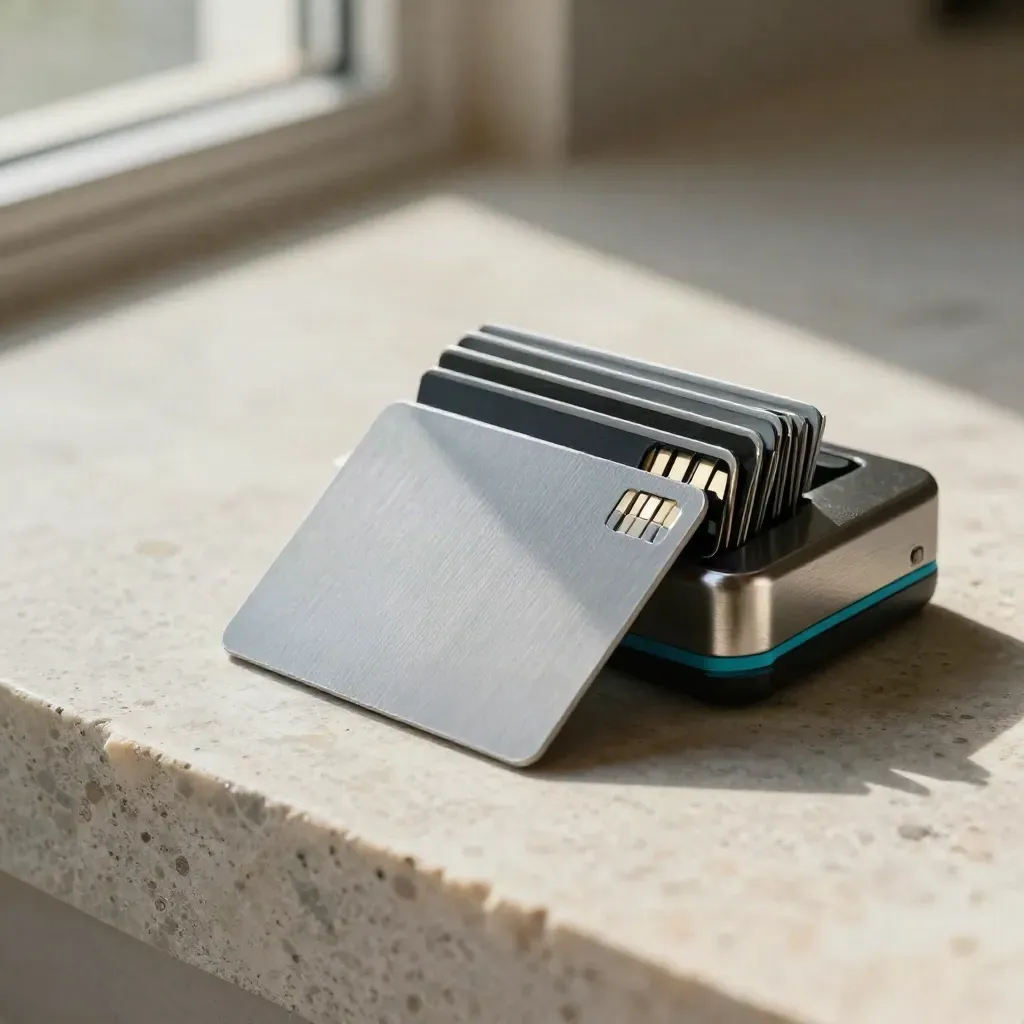
Blank EMV cards, chip-reader dock and metal card case on pale limestone with a cyan accent

CedarPay

Rack-mounted monitoring module with toggle banks and cable comb on slate concrete.

Live Dashboards

Cable connectors and metal couplers radiating on graphite stone in dramatic overhead light.

Graph Mapping

Platform

Chart Templates

Start with flow, trend, and rank charts.

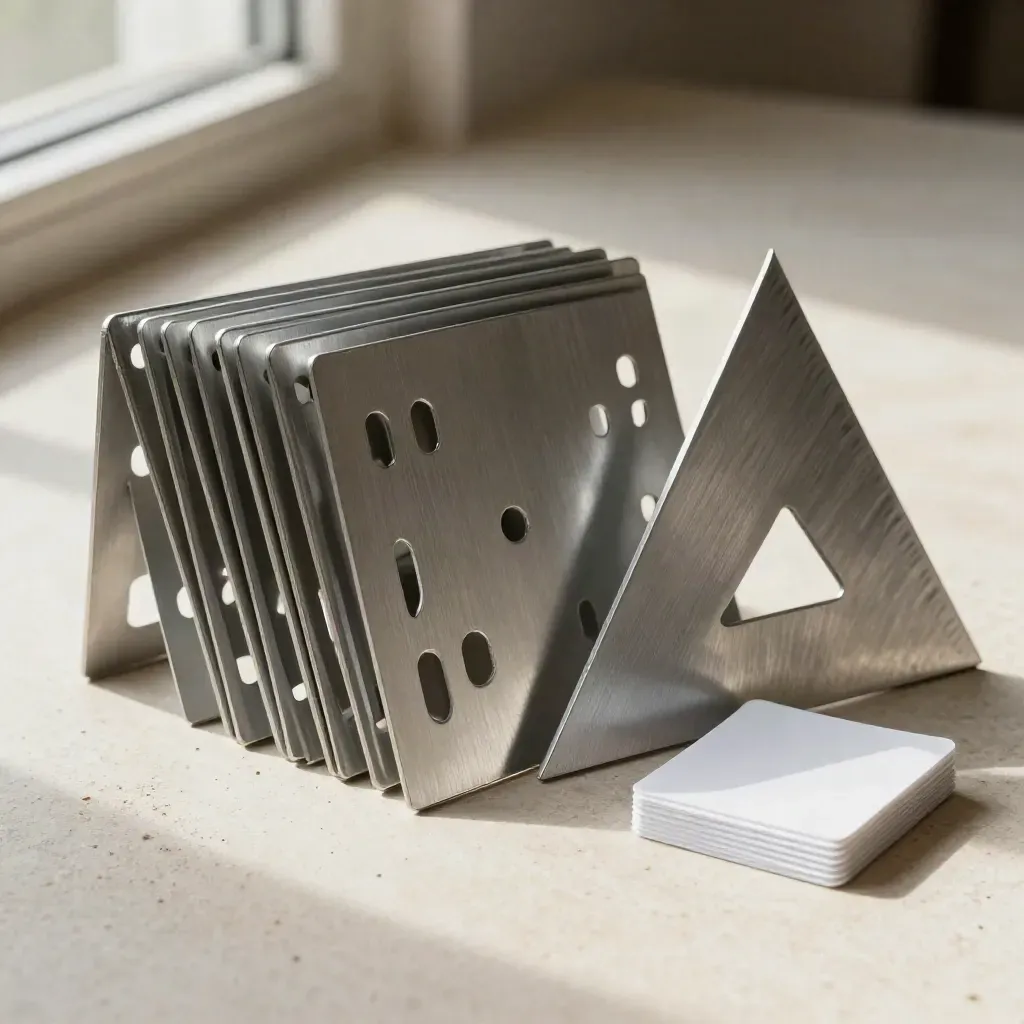
Aluminum template plates and a drafting triangle on cream stone with white index tabs.

Chart Templates

Start with flow, trend, and rank charts.

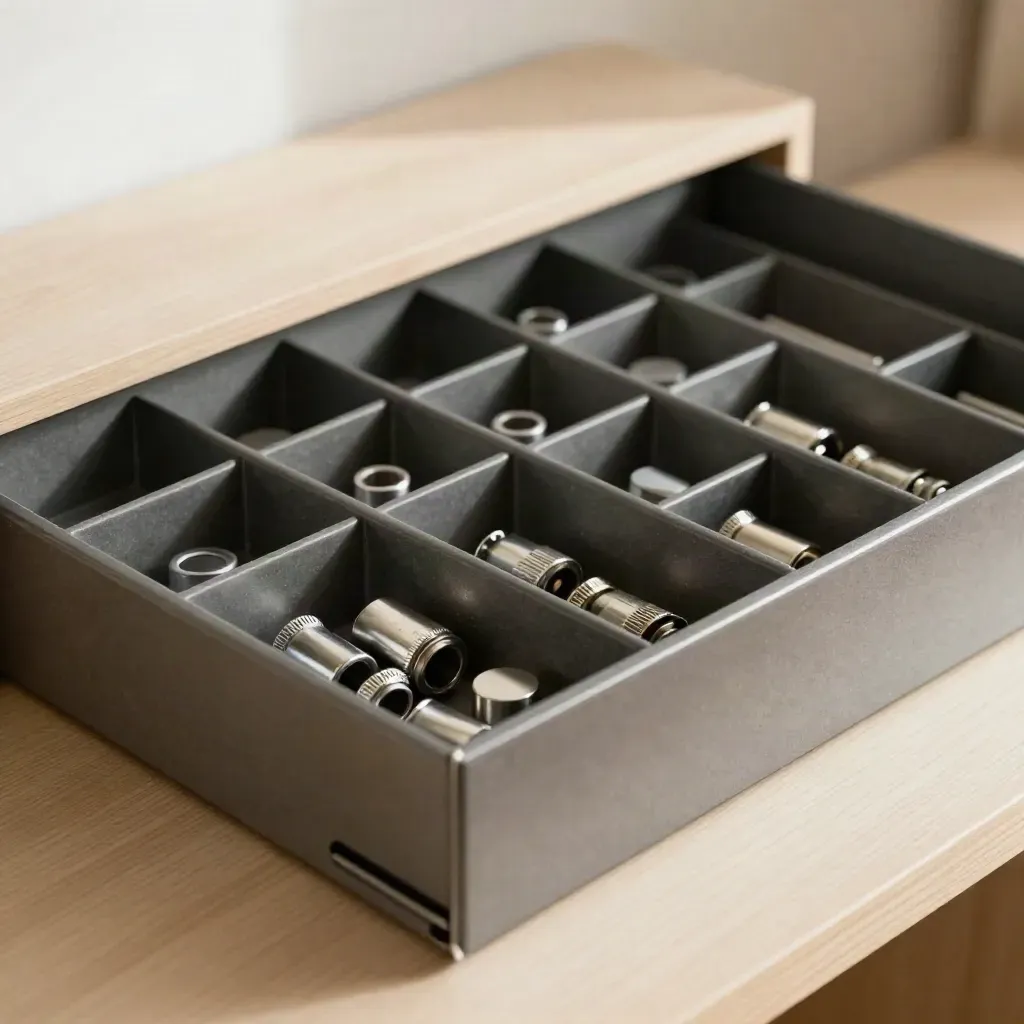
Graphite drawer organizer with ferrules and adapter caps on pale wood, lit by soft window light.

Saved Workflows

Move from raw data to a repeatable flow for each team task.

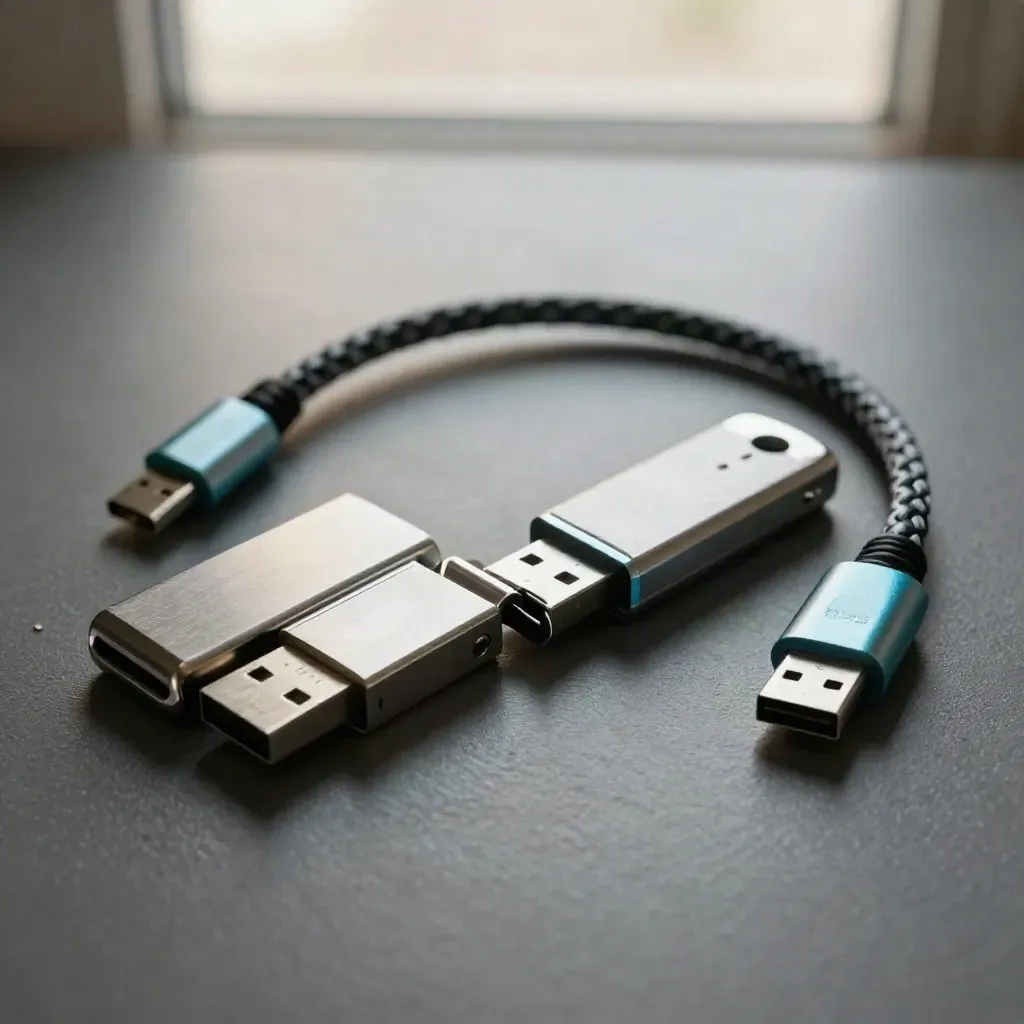
Top-down macro of two USB drives, a metal clip, and a braided cable on graphite.

Chart Sharing

Share charts by link or export them for decks, docs, and client updates.

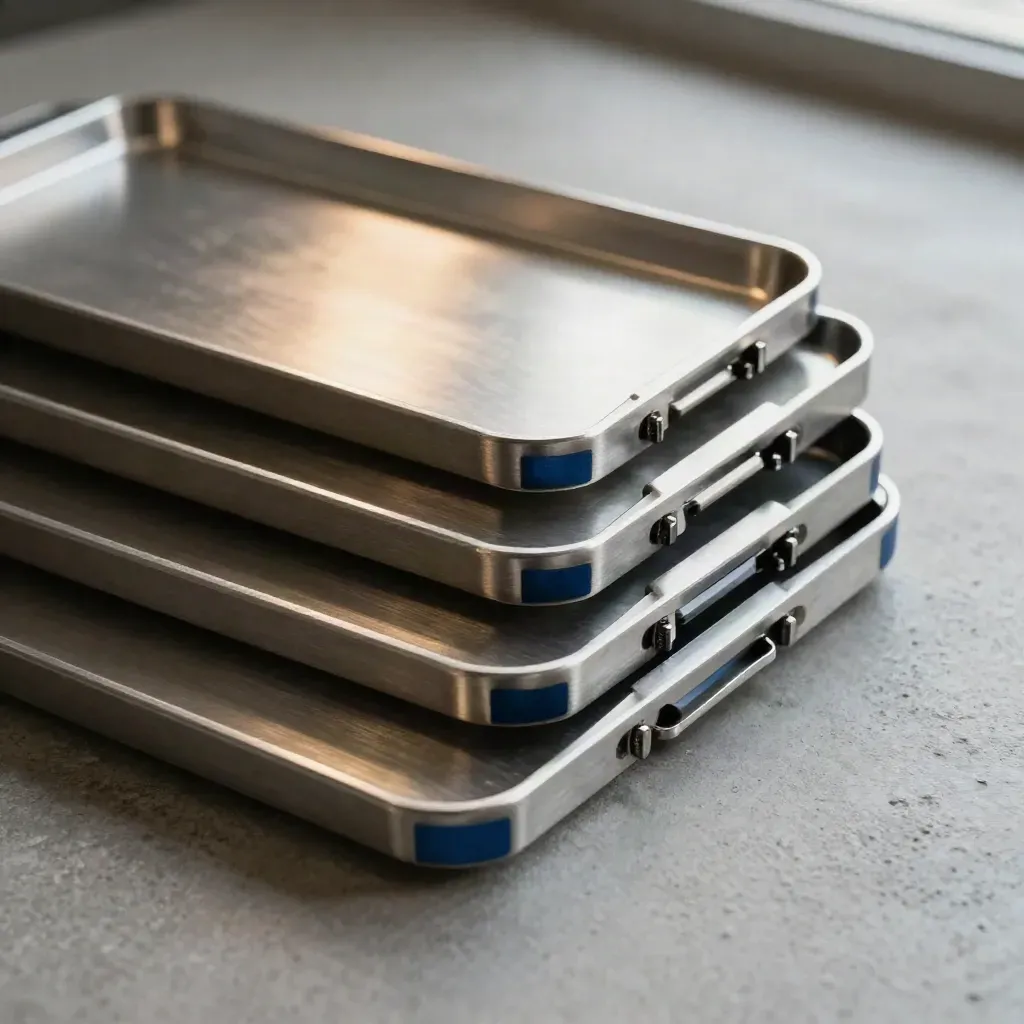
Aluminum trays and precision spacers aligned diagonally on concrete
01

Team Views

Keep product, ops, and finance on one page with a single source of truth.

Wireless clicker, closed folio and desk timer on concrete behind frosted glass.
02

For Product Teams

Watch feature use, funnels, and account health in one place.

Macro of server patch cables, SSD, and patch panel on a concrete shelf, seen through a blurred cable loop.
03

For Data Teams

Map messy tables, clean views, and ship reports without extra steps.

Use cases

For Business Leaders

Read weekly KPIs, spot gaps, and share clear updates with the team.

01

Chart Templates

Start with flow, trend, and rank charts.

02

Saved Workflows

Move from raw data to a repeatable flow for each team task.

03

Chart Sharing

Share charts by link or export them for decks, docs, and client updates.

04

Team Views

Keep product, ops, and finance on one page with a single source of truth.

Closed navy folio, brass pen and round clock on an oak sideboard, seen through blurred glass

Use case 01

For Business Leaders

Read weekly KPIs, spot gaps, and share clear updates with the team.

Silver filaments stream into a white bloom through graphite haze, with calm copy space below.

Use case 02

3x

faster report builds

Use case 03

24/7

live dashboard access

50+

chart types and views

50+

chart types and views

1 link

to share each report

Pale concrete and plaster backdrop with soft grey gradient and open lower space for pricing cards.

free forever

Free

1 live dashboard 3 saved charts 1 graph view PNG and CSV export Basic share links

per seat / mo

Pro

10 team dashboards Graph filters and drill-downs Weekly KPI reports Saved data maps Private chart links Three analytics workflows

Pricing

Enterprise

Unlimited dashboards SSO and role access Scheduled KPI packs Team folders by group Audit logs for admins Dedicated setup help

annual plan

Enterprise

Custom

Unlimited dashboards

SSO and role access

Scheduled KPI packs

Team folders by group

Head of Analytics @ NorthwindPopular

We cut report prep from hours to minutes, and the whole team reads one dashboard

Custom

Nadia Brooks

Product Ops @ Vertex Labs

Graph views made customer paths easy to read for both analysts and PMs

Custom

Leo Martin

Proof

Teams that turned the product into habit

Verified

“Shared links and KPI packs keep our weekly review short and on time”

Closed linen briefing folio, glass paperweight, and brass pen on terracotta plaster.

Priya Iyer

BI Manager @ Orion Data

Verified

“Slack”

Macro of aluminum rings and a braided connector locking into a precision coupler on brushed steel.

Build clear dashboards, map links, and share reports that keep teams in sync.

Verified

“GitHub”

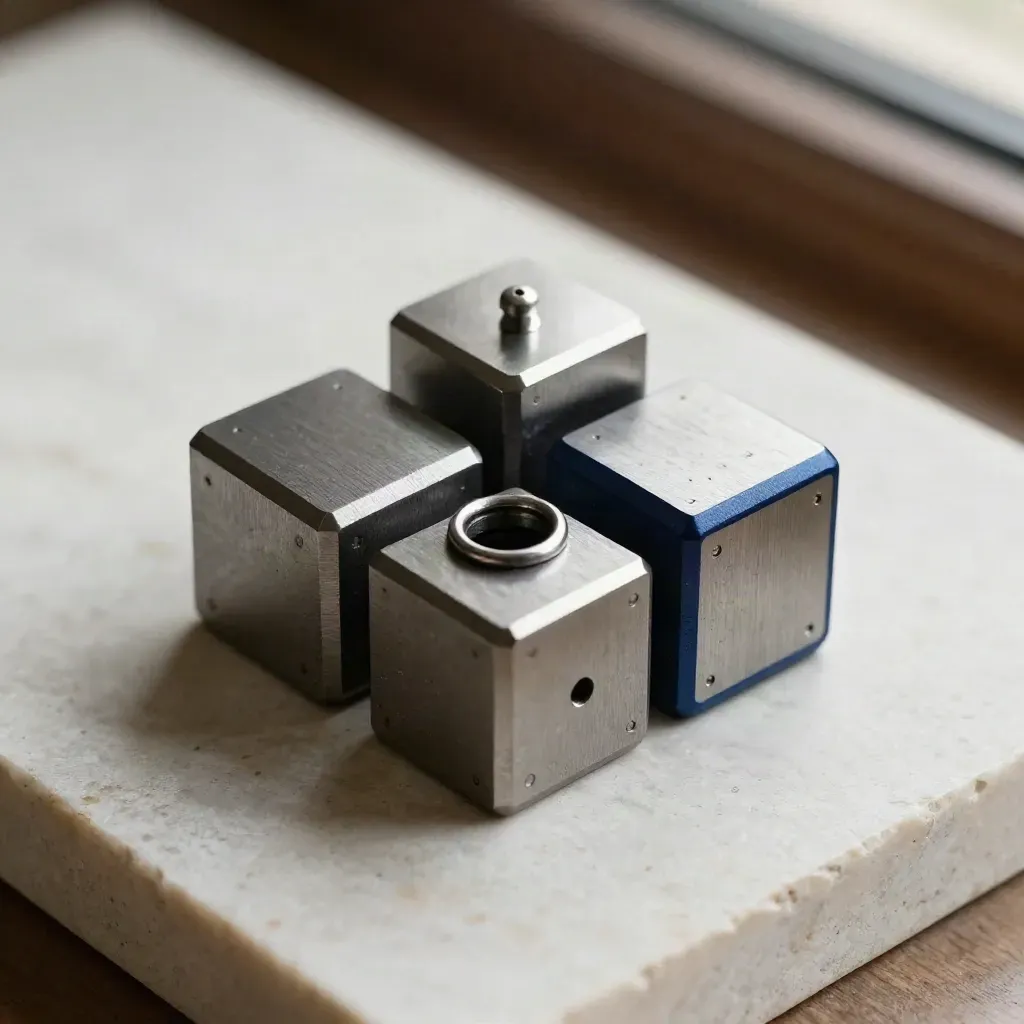
Machined graphite cubes, hex pin, and split ring on pale limestone in dramatic top-down light

Build clear dashboards, map links, and share reports that keep teams in sync.

Integrations

Jira

Build clear dashboards, map links, and share reports that keep teams in sync.

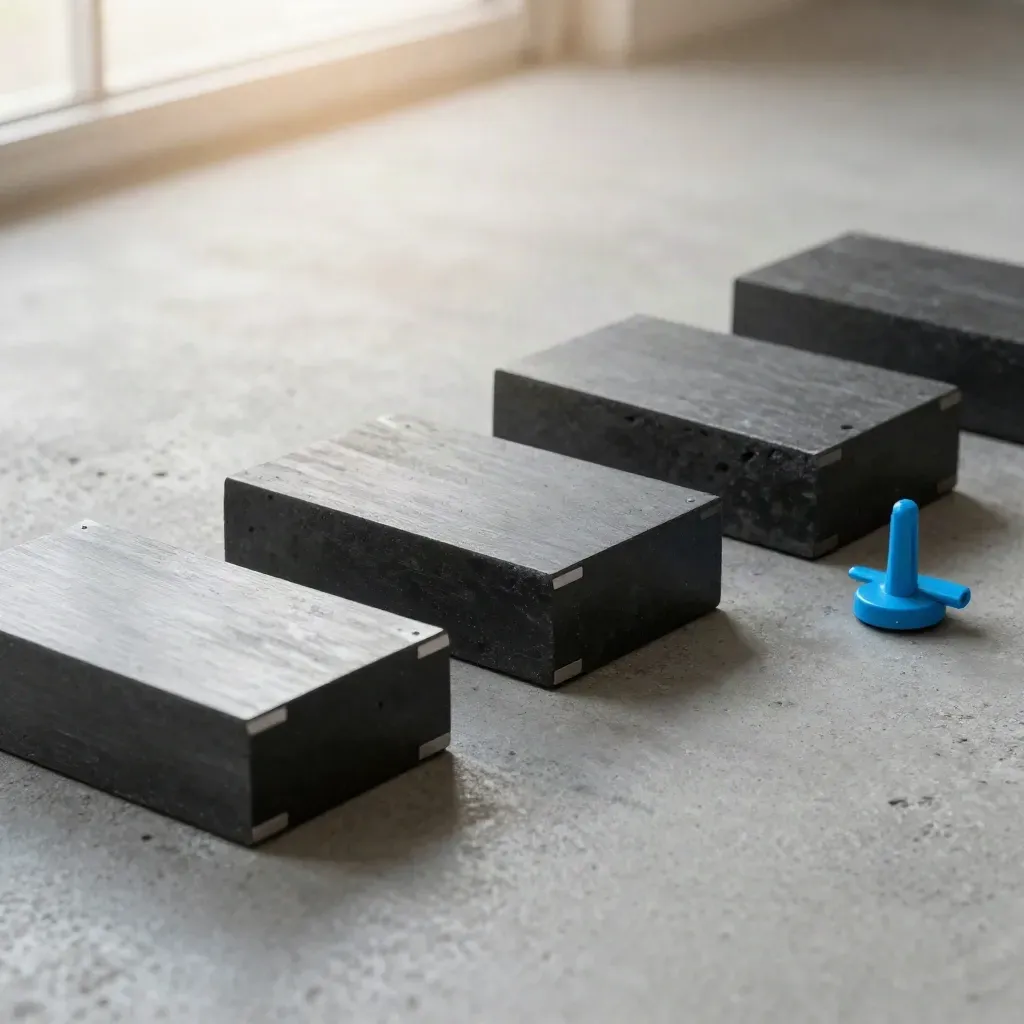
Graphite modular blocks and bridge plates with a cyan cable anchor on concrete.
Jira

Jira

Build clear dashboards, map links, and share reports that keep teams in sync.

The Map

The Map

Get the changelog and workflow ideas

Fresh ideas, launches, and guides from the team.